How I Organize My Marketing Experiments
Marketing Backlog 101
Hello 👋
Welcome to this 7th edition written exclusively for paid subscribers of my Substack:
How I organize my marketing experiments
In this edition you’ll learn:
Why you should have a backlog
How to install a backlog
How to organize and track experiments
1. Why You Should Have a Backlog
I have been doing marketing experiments for the past 8 years. I always keep track of the experiments so I can create a second brain. This helps me to do 3 things:
Learn from trial and errors and find winning tactics
Identify patterns
Get content ideas
🧠 The return on investment (ROI) of the backlog is insane. It’s free and it becomes a second brain that takes you from good to great marketer.
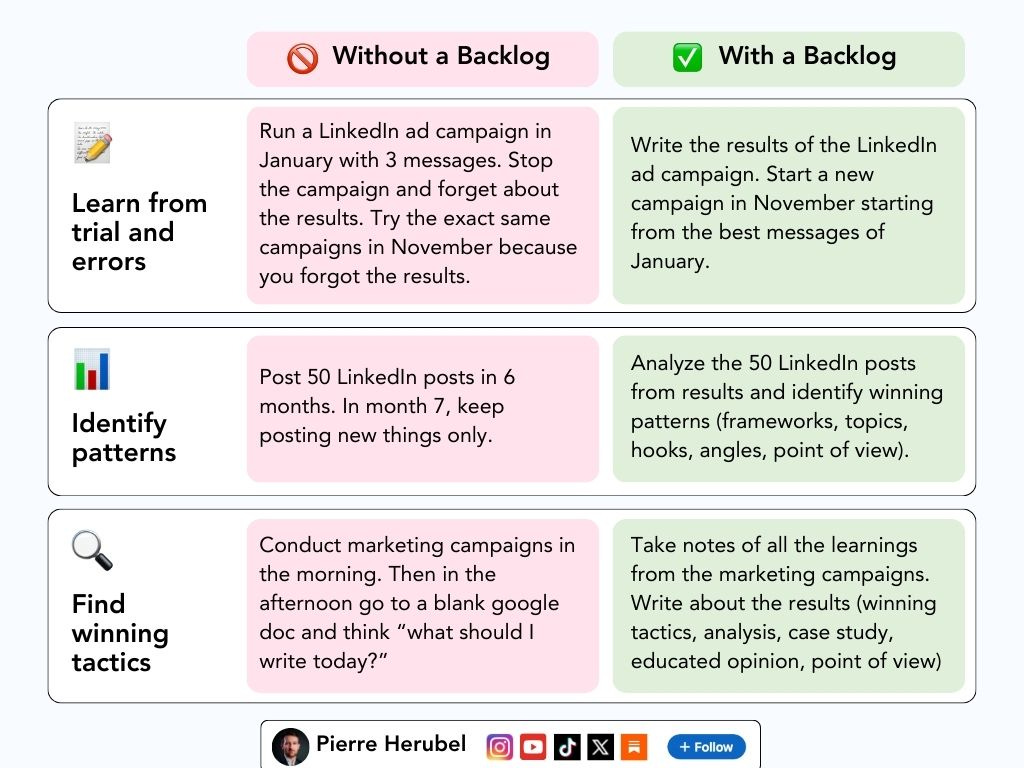
Here is a comparison to understand the importance:
Learn from trial and errors and find winning tactics
⛔ Without a Backlog: Run a Linkedin ad campaign in January with 3 messages. Stop the campaign and forget about the results. Try the exact same campaigns in November because you forgot the results.
✅ With a Backlog: Write the results of the Linkedin ad campaign. Start a new campaign in November starting from the best messages of January.
Identify patterns
⛔ Without a Backlog: Post 50 Linkedin posts in 6 months. In month 7, keep posting new things only.
✅ With a Backlog: Analyze the 50 Linkedin posts from results and identify winning patterns (frameworks, topics, hooks, angles, point of view).
Find winning tactics
⛔ Without a Backlog: Conduct marketing campaigns in the morning. Then in the afternoon go to a blank google doc and think “what should I write today?”
✅ With a Backlog: Take notes of all the learnings from the marketing campaigns. Write about the results (winning tactics, analysis, case study, educated opinion, point of view)
Here is a recap:
In other words, the backlog will help you to avoid this situation:
2. How to Install a Backlog
Now that you know WHY you need to install a backlog, here's how you should do.
First of all, here is what a backlog looks like:
This is an extract of my video “How to Create a Marketing Backlog in 6 Steps”
My backlogs are composed of 6 columns:
Experiment title: One short sentence to know what the experiment is about in one second
Description: Bullet points to describe what’s going to happen (or what happened)
Objectives: What I aim to achieve with this experiment
Plan: A link to another document that explains the plan in details. Or an in depth roadmap of what is going to happen. (Not mandatory when you are experienced and know exactly the steps)
ICE Score: It’s a methodology to rank and prioritize your experiments when you have many in mind. Find a clear explanation in this part of the video.
Results: At the end of the experiment, you should report the results in this column to later come back to it.
Here is a quick example of an experiment plan in a backlog:
To create a backlog like this one you can use tools such as:
Google sheet
Excel
Trello
Notion
Asana/Monday
🧠 The most important is to turn this backlog into your own library and database of experiments.
How to use a backlog:
Once your backlog template is installed, you can start organizing experiments:
List all your experiments with the details in the column
Attribute an ICE score to each experiment (impact x confidence x ease)
Prioritize the experiments based on the highest scores
Select the experiments with highest score and plan them with weekly sprint
Start on day 1
Analyze on day 7
Iterate on day 8
Here’s an example of timeline I have used in the past:
🧠 Tip: If you use a tool like notion or monday, you can add a date column to the backlog and show the experiments with a calendar view
The most important part is to write the results once the experiment is done
Qualitative results: Any important information that cannot be translated into numbers
Interactions
Conversations
Verbatims
Feelings (yes, how you felt)
Quantitative results: Every track numbers that make sense, the experiment should track a north star metric.
Revenue pipeline
Click through rate
Number of demos
Closing rate
🧠 Tip: You can try to improve a percentage instead of a number. Example: don’t try to increase your revenue but try to increase your closing rate. This helps you to pinpoint a specific part of the funnel that needs improvement. So you can conduct experiments and track the impact on the rate. Find your moving metrics.
Exercice
As a next step, I invite you to create your own marketing backlog with one of the tool.
Then, plan an experiment, execute it, and report the results. You can reply back to this email if you want.
Alright, that’s the end of this edition. You now have all the tools to build your marketing backlog and organize your experiments.


